New in Version 16.1
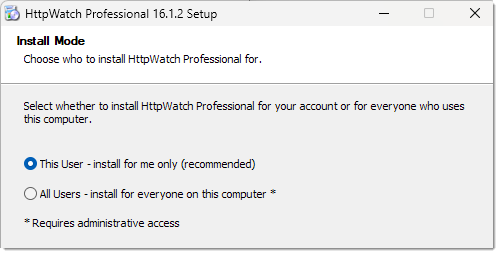
Install HttpWatch Without Admin Rights
HttpWatch can now be installed by a user without requiring local administrative rights, making it easier when you ask customers or in-house users to install HttpWatch Basic to record a log file. The installation will be local to their account and won't be available to anyone else using the same machine. Installing for all users is still possible by starting the installer with the /all-users=1 command line flag:
New in Version 16.0
Track Cookies Set by JavaScript
HttpWatch can now capture cookies that are assigned through JavaScript as well as cookies sent and received through HTTP headers. This makes it much easier to diagnose authentication problems, consent issues, tracking bugs and other client-side behaviour that would previously have been harder to trace.
A new JavaScript column in the Cookie tab can be used to view the source location where a cookie was set:
Improved Console Output and Analysis
The Console window has been significantly enhanced to provide more useful debugging information. Console entries can now display additional metadata such as timestamps and stack traces in a foldable format:
Support has also been added for output generated by console.table, console.count, console.timeLog and console.timeEnd, with improved formatting of object values and other console data. Links in console output can be clicked to navigate directly to the related source code:
The View menu now includes options to expand or collapse all console entries and control whether new entries are expanded by default.
Warnings for Incorrect Content Types and Headers
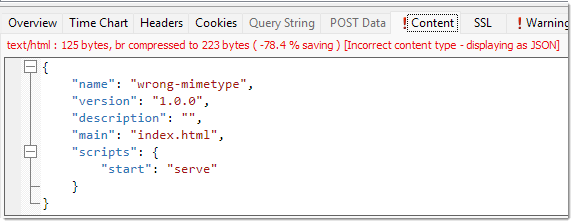
HttpWatch now detects cases where a server returns content with an incorrect content type or content header. New warnings, HW3009 and HW3010, highlight these problems and help identify server-side misconfigurations more quickly:
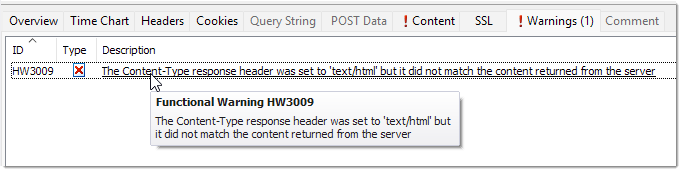
When common content types such as HTML, JavaScript, CSS, JSON or XML are detected with the wrong MIME type, HttpWatch will also apply the appropriate formatting and display a warning icon in the Content tab:
Better Integration with Chrome and Edge
Version 16 improves the way HttpWatch integrates with Chromium based browsers. When switching to a browser tab that is being recorded, the matching HttpWatch window is brought to the foreground. Likewise, activating the HttpWatch window will automatically switch to the corresponding browser tab.
The browser toolbar icon also now provides a clearer indication when recording is active:
![]()
More Accurate Timing and Request Handling
Request timing has been improved to provide more accurate start times and duration values, particularly in cases involving redirects and DevTools protocol timing differences.
These changes also improve the way redirected requests are handled so that the correct headers and timing information are displayed more reliably:
Browser and Operating System Information from HAR Files
When opening HAR files, HttpWatch can now extract browser and operating system information and display it as part of the session details. This provides more context when analysing traces captured outside HttpWatch:
Other Improvements in Version 16
Other enhancements in this release include a resizable Warnings dialog, improved title bar text showing the browser tab title and URL, faster handling of large request lists, and fixes for a number of issues affecting console search, SSL timing values and browser automation.