Grouping of Recorded Requests
The Request Grid is grouped by page unless there is no page grouping information available or grouping as been disabled using the 'Group By Page' option on the view menu.
Please refer to the sections below that describe the numbered items in this screen shot:
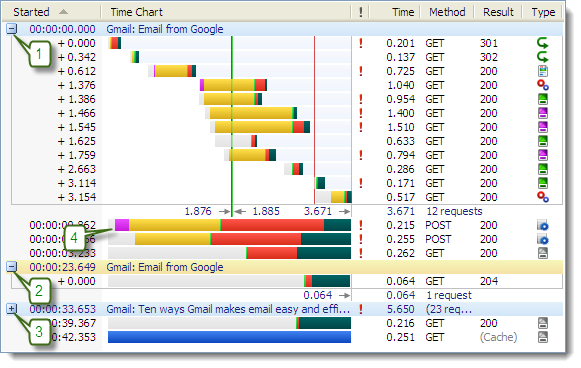
1. Expanded Page Group
This page group starts at 0:00.000 in the log file and contains 12 requests. The page header shows the title of the page and displays a '-' symbol that can be used to collapse the group. The summary line at the end of the group shows that the page took 3.671 seconds to download, The blue color of the page header indicates that this is a normal page load.
The structure and color scheme used in the time chart for the page are described in Page Level Time Charts.
2. Expanded Dynamic Page Group
This page group starts at 0:23.649 in the log file and the yellow color of the page header indicates that this was a dynamic change to a previously loaded page. Dynamic page groups are usually the result of AJAX calls or modifications made by Javascript functions or event handlers.
3. Collapsed Page Group
This page group has been collapsed using the +/- control. The page header shows the page title, total time and the number of requests.
4. Ungrouped Requests
Some requests do not directly relate to a page and will be displayed outside a page group. For example, these requests may be downloading the favicon for a site or verifying an SSL certificate has not been revoked.