HttpWatch Time Charts
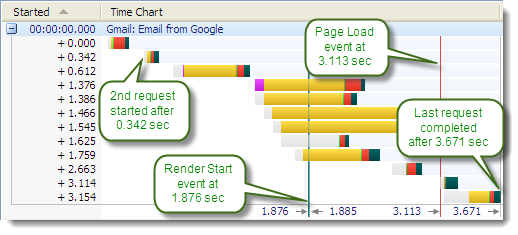
Colored bars are displayed in the time chart column of the Request Grid to show the relative timing of requests making up a page and the different phases of an HTTP request, e.g. connect, send, etc. Vertical lines are also included to show where certain page level events occurred.
The screen shot below shows a time chart from the Google Mail home page:
Request Timings
The colored horizontal bars are described below:
|
Color |
Timing Name |
Description |
|
|
Blocked |
The Blocked time includes any pre-processing time (such as cache lookup) and the time spent waiting for a network connection to become available. Browsers limit the number of concurrent network connections per host name (i.e. www.microsoft.com) and will queue up requests until a network connection is available. Often the Blocked time is the most significant factor in the download time of images embedded in a web page. The HTTP/2 protocol was designed to overcome this restriction by allowing multiple requests to be made concurrently over a single connection. |
|
|
DNS Lookup |
DNS Lookup is the time required to resolve a host name (e.g. www.google.com) into a numeric IP address (e.g. 216.239.59.99). |
|
|
SSL Handshake |
SSL Handshake is the time required to setup an SSL session between the browser and the web server |
|
|
Connect |
Connect is the time required to create a TCP connection to the web server (or proxy). If a secure HTTPS connection is being used this time includes the SSL handshake process. Keep-Alive connections are often used to avoid the overhead of repeatedly connecting to the web server. |
|
|
Send |
Send is the time required to send the HTTP request message to the server and will depend on the amount of data that is sent to the server. For example, long Send times will result from uploading files using an HTTP POST. |
|
|
Wait |
Wait is the idle time spent waiting for a response message from the server. This value includes delays introduced due to network latency and the time required to process the request on the web server. |
|
|
Receive |
Receive is the time taken to read the response message from the server. This value will be depend on the size of the content returned, network bandwidth and whether HTTP compression was used. |
|
|
Cache Read |
Cache Read is the time taken to read the content from the browser cache during (Cache) or 304 responses. |
Page Event Lines
The colored vertical event lines are described below:
|
Color |
Event Name |
Description |
|
|
Render Start |
The Render Start event occurs when the browser first starts to display a downloaded page. |
|
|
DOM Load |
The DOM Load event is fired when the page's DOM (Document Object Model) is completely loaded and available for use by scripts on the page. Other resources, such as images, may not have been downloaded when this event occurs. This corresponds to the DOMContentLoaded event in the browser. |
|
|
Page Load |
The Page Load event fires when both the DOM (Document Object Model) and images have been loaded. This corresponds to the onload event in Chrome and Edge |
|
|
HTTP Load |
HTTP Load marks the completion of all HTTP or HTTPS requests made by the page. |


